This page illustrates the use of graph3d.ado for Stata. See Stata. To download the graph3d package including the ado file type
-
. ssc install graph3d
in Stata or click
Before running any of the examples, set up the exemplary dataset by running
-
. clear
. set obs 630
. gen x = int((_n - mod(_n-1,30) -1 ) /30 )
. gen z = mod(_n-1,30)
. gen y = normalden(x,10,3)*normalden(z,15,5)*10000
. gen w = x*z
What Stata experts say:

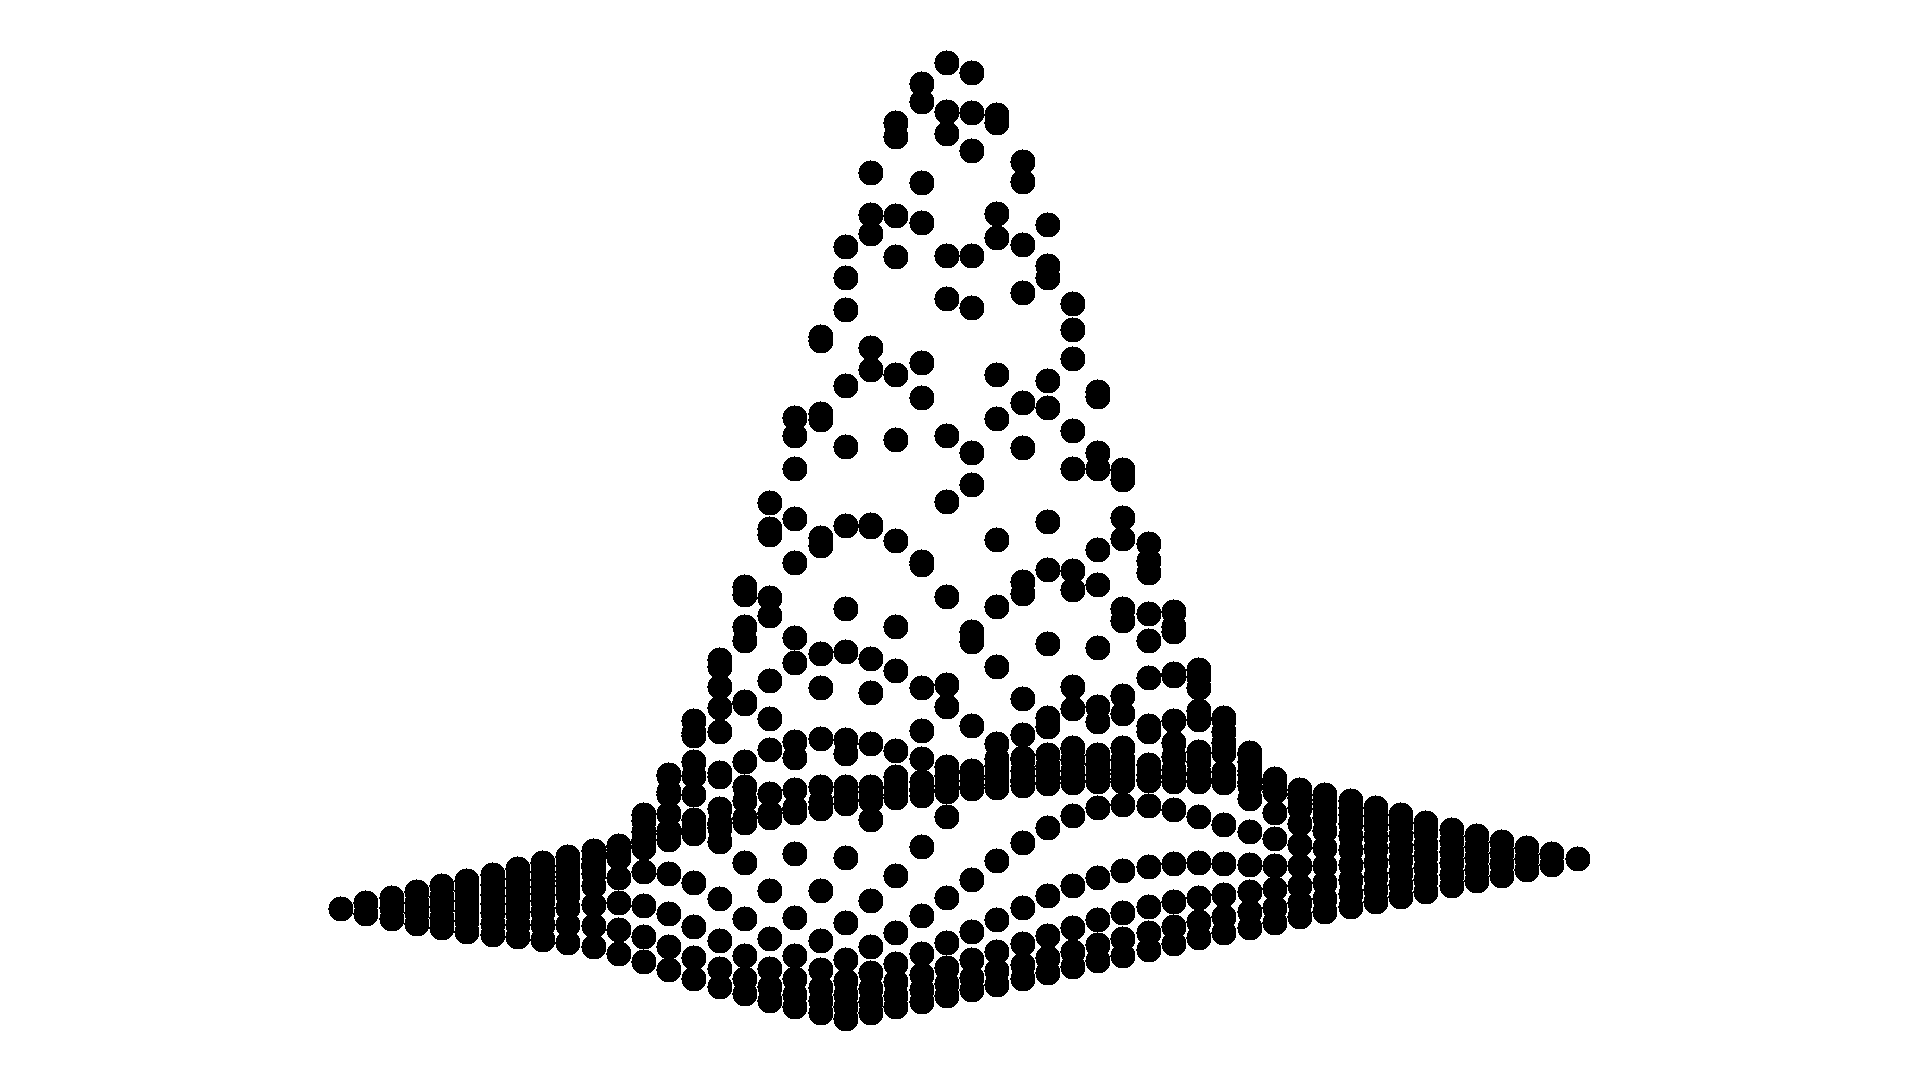
Example 1: Default 3D-Plot
-
. graph3d x y z
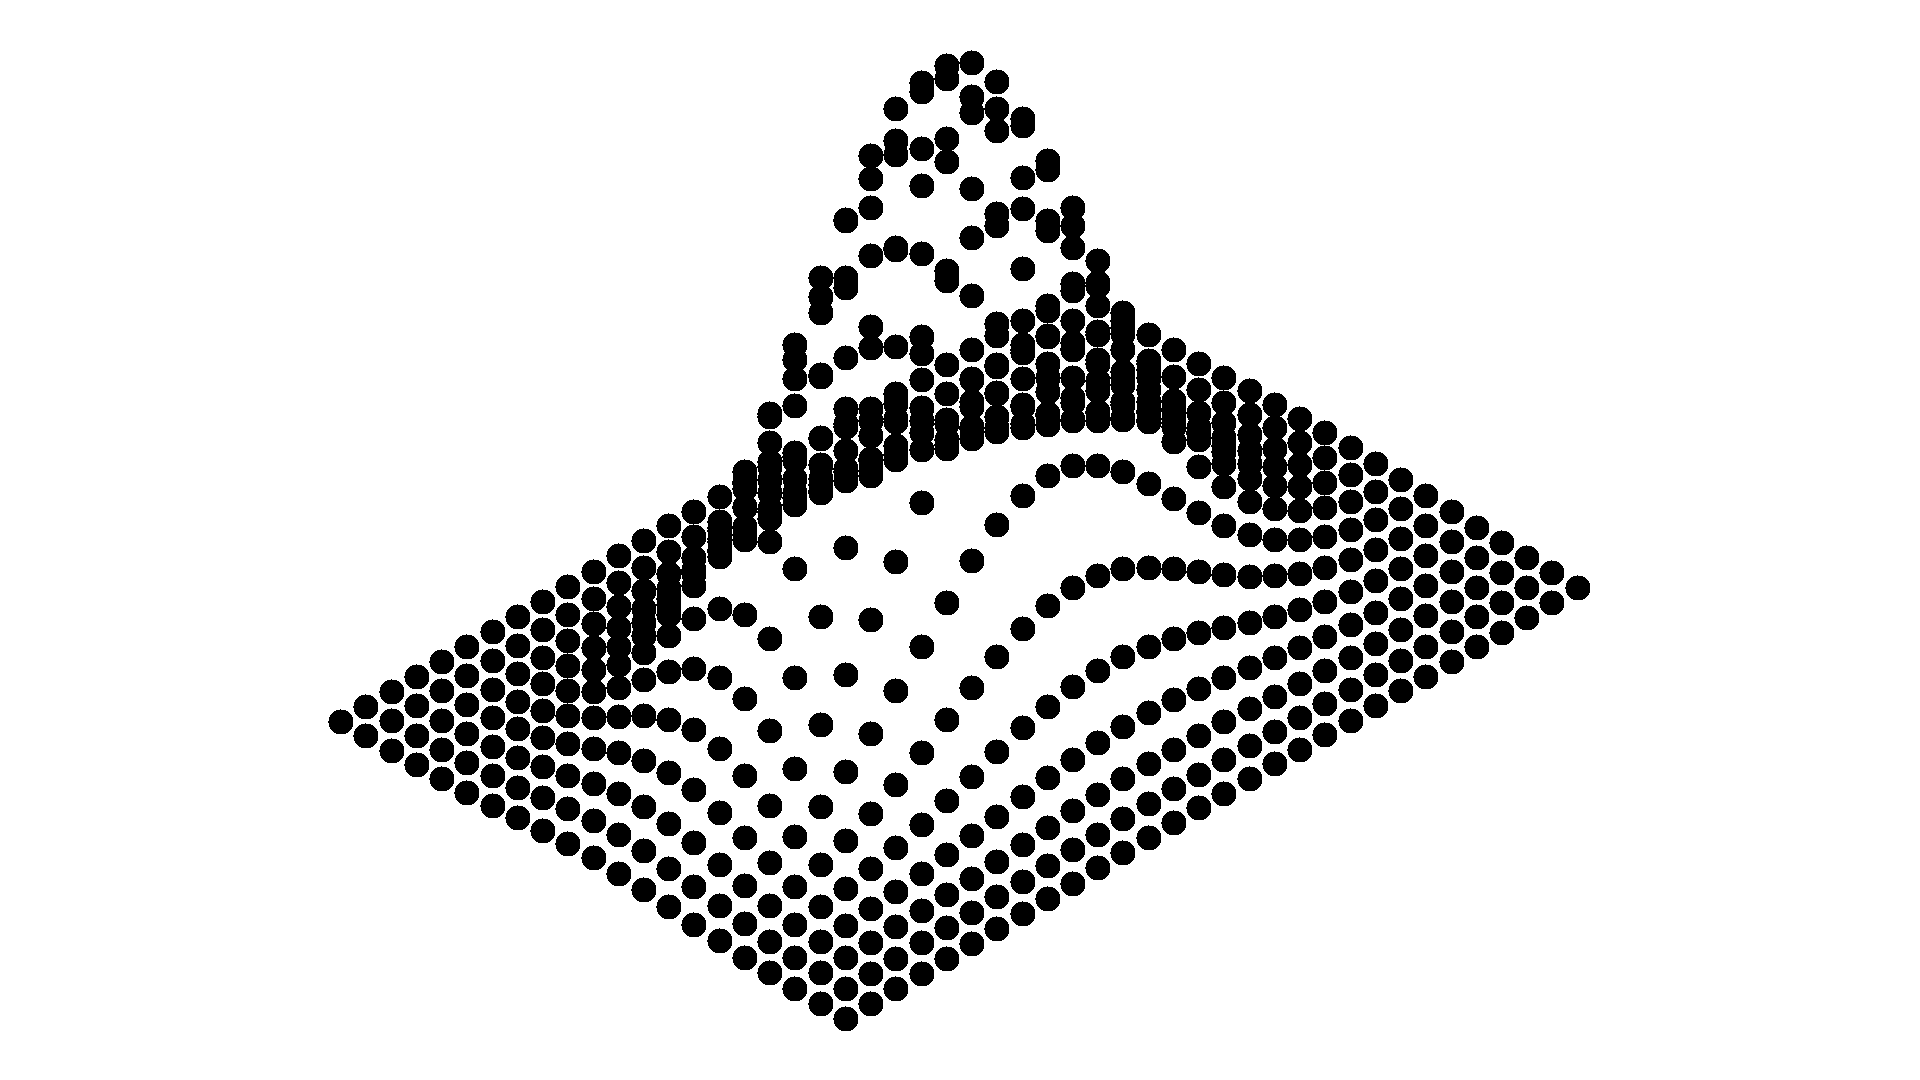
Example 2: Default 3D-Plot rotated by 75 degree about
the width-axis
-
. graph3d x y z, xang(75)
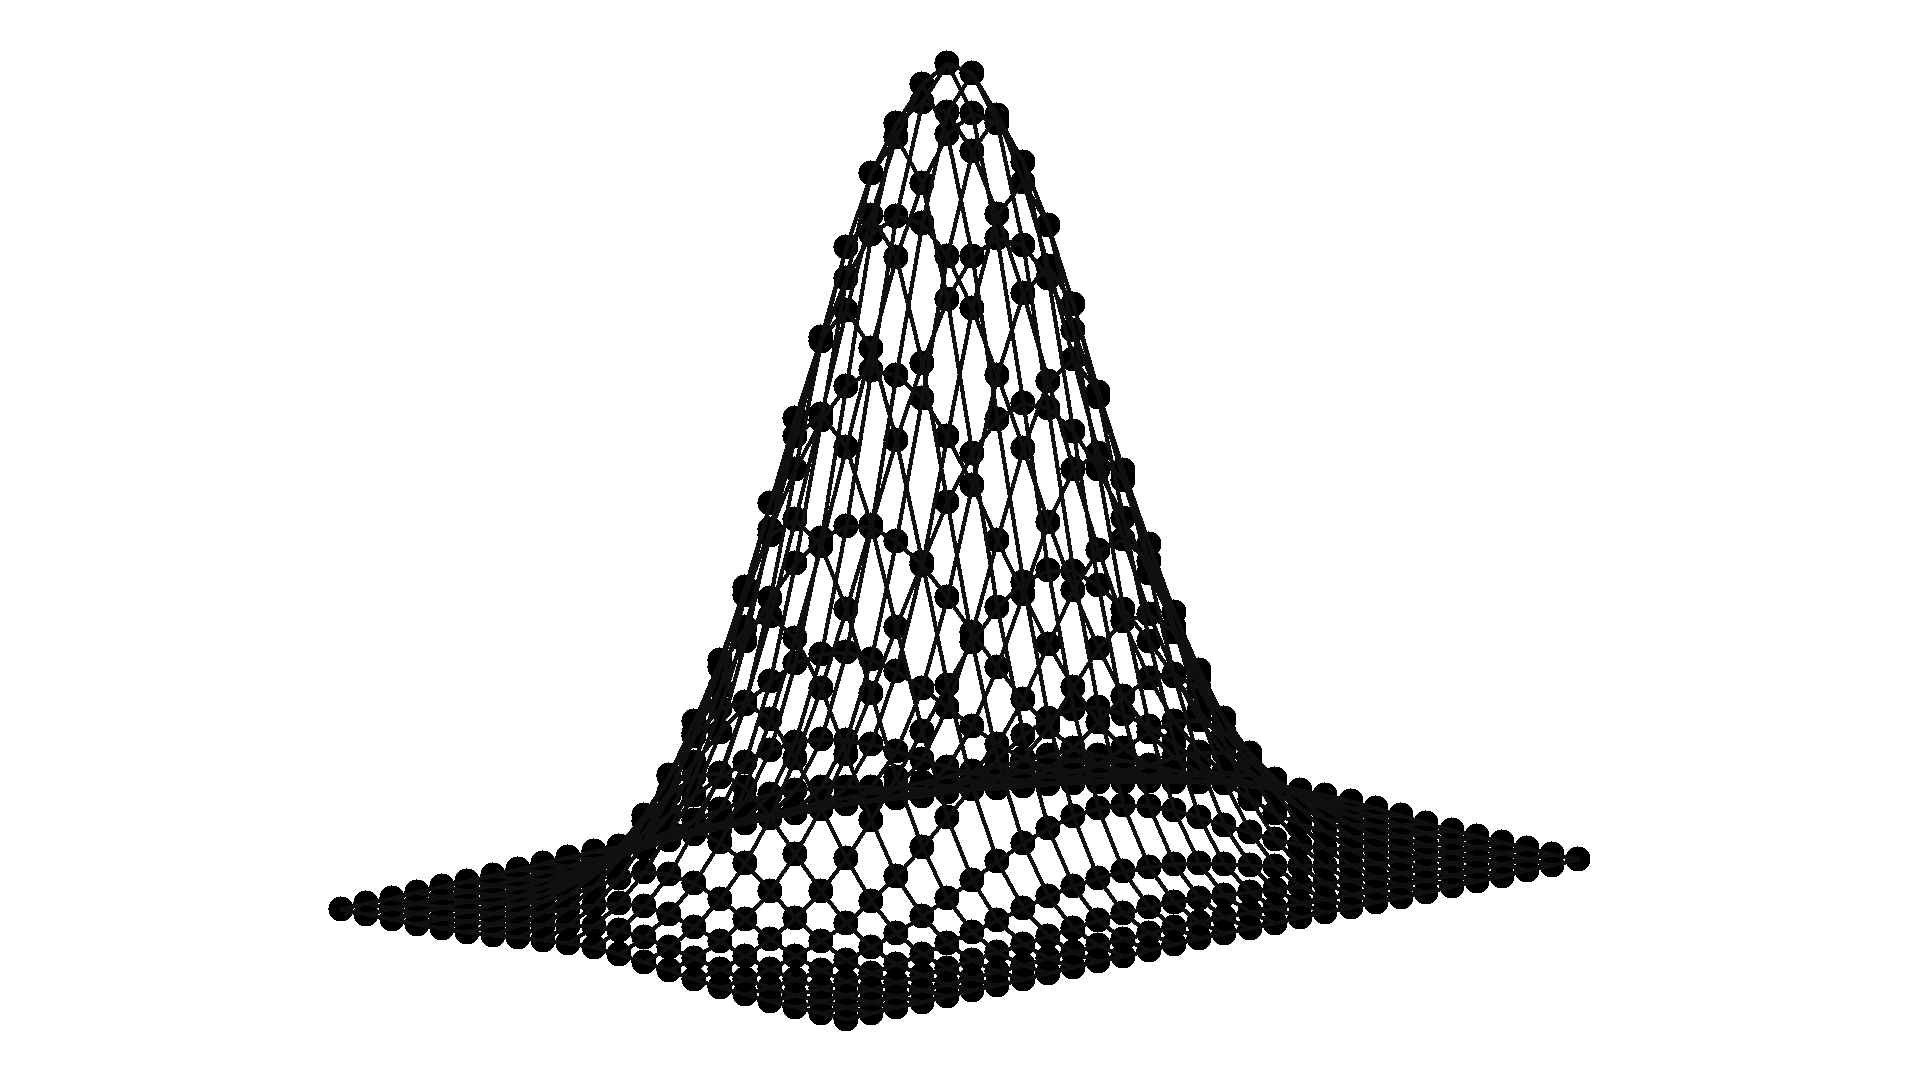
Example 3: Wireframe default 3D-Plot
-
. graph3d x y z, wire
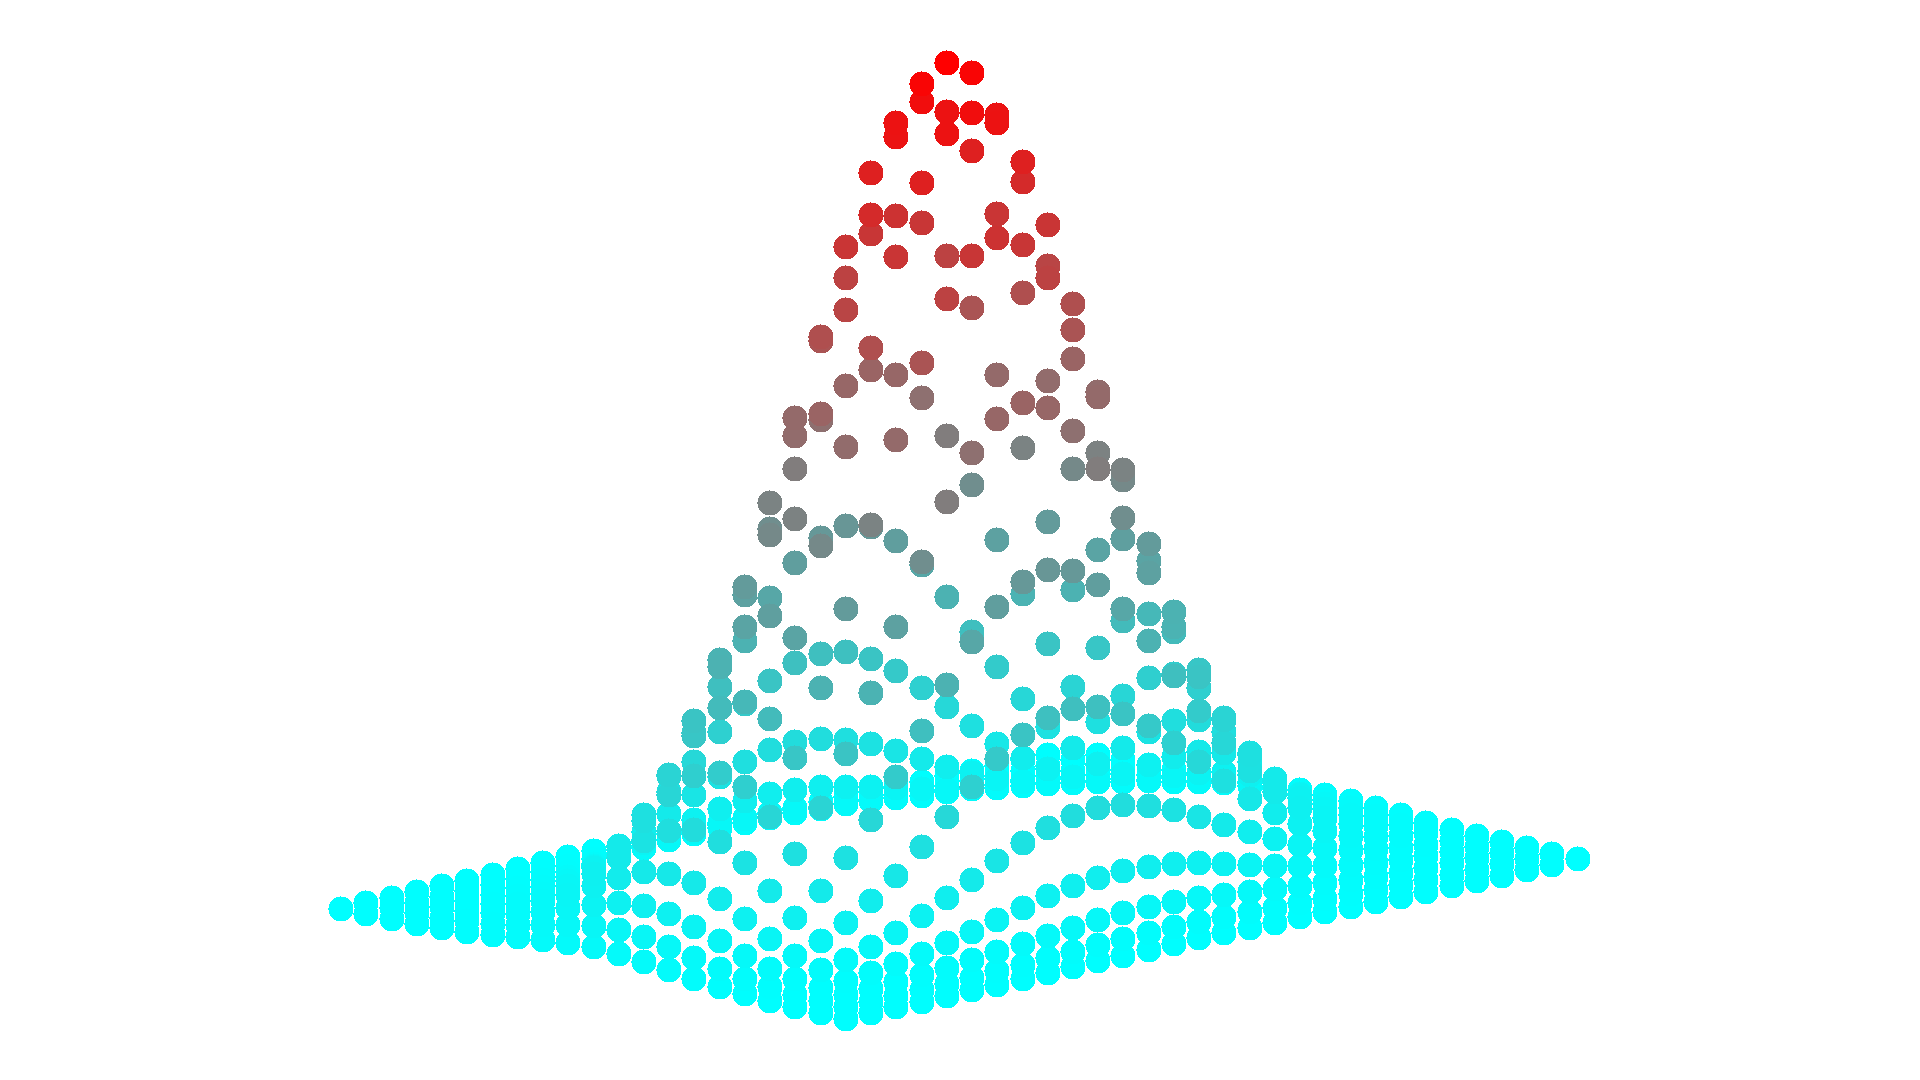
Example 4: Two-colored 3D-Plot
-
. graph3d x y z, colorscheme(cr)
[Try also . graph3d x y z x, colorscheme(cr)]
[and . graph3d x y z w, colorscheme(cr)]
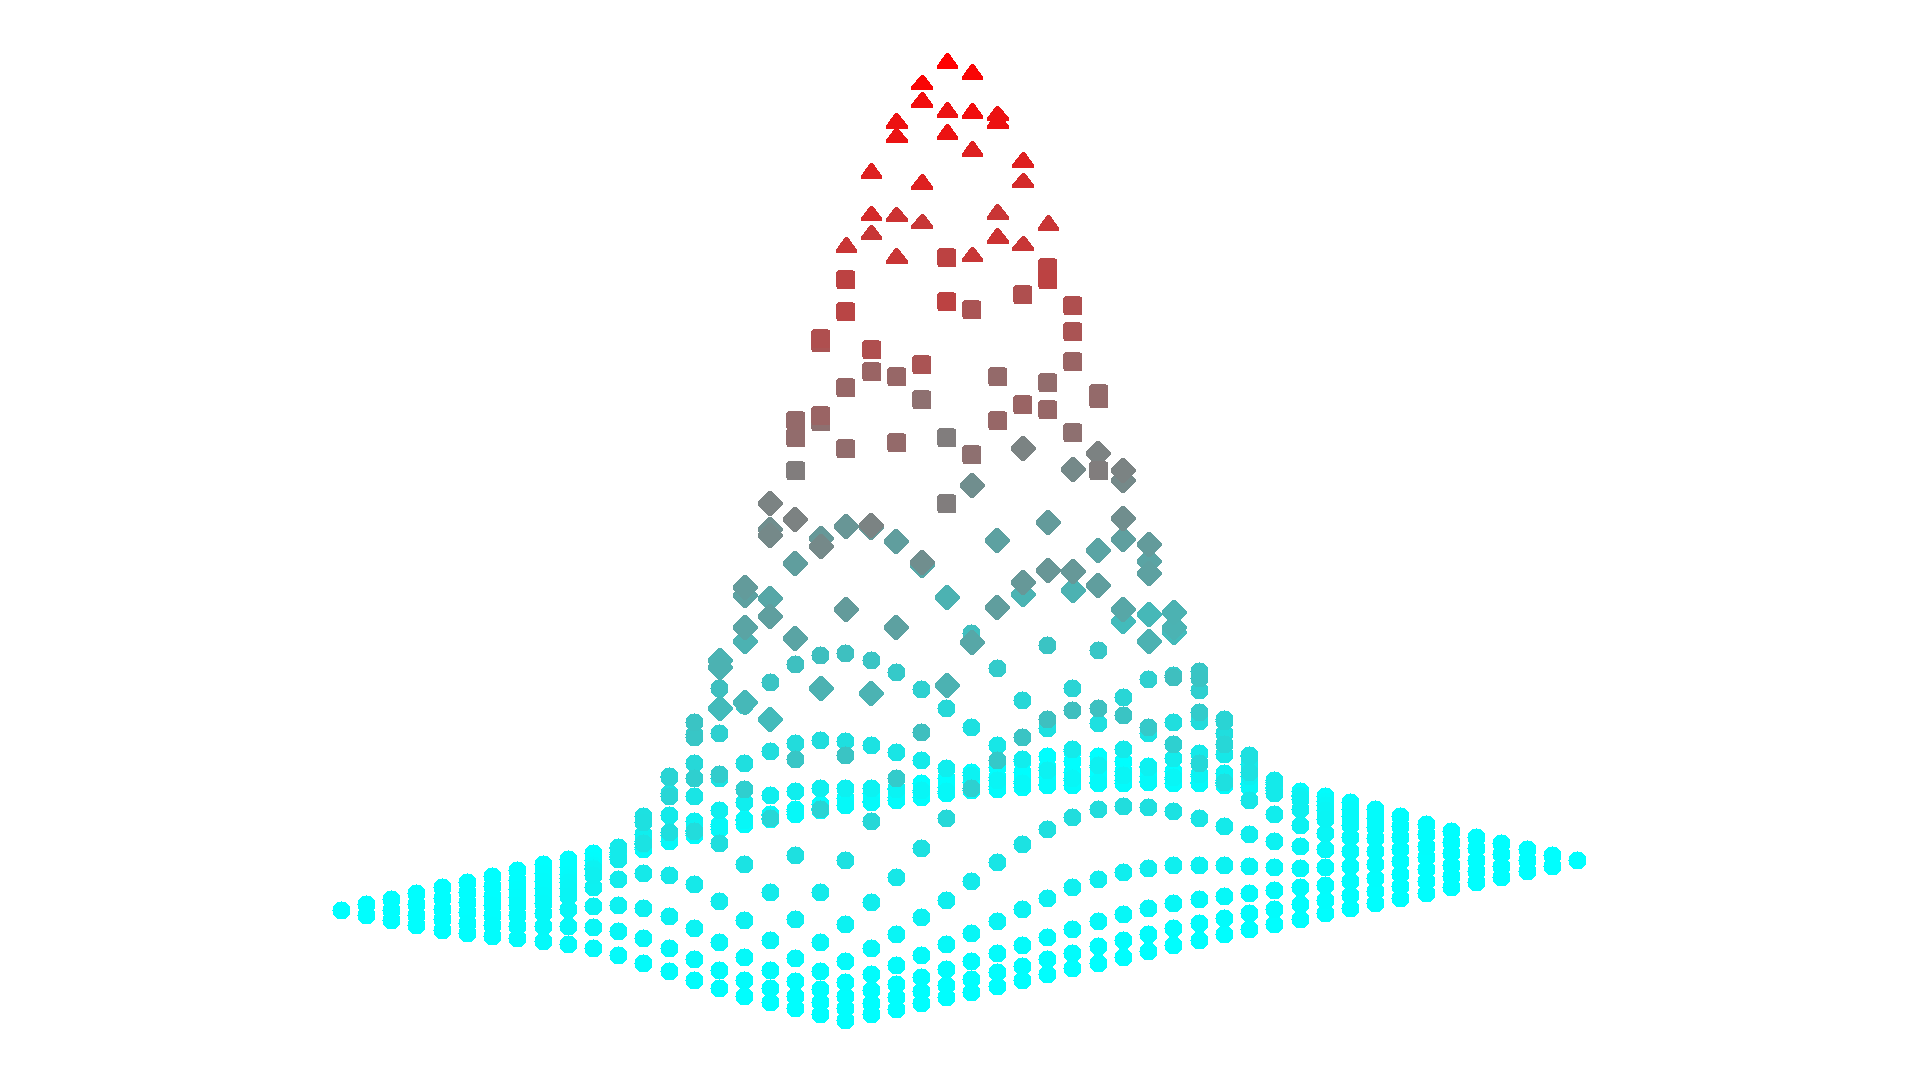
Example 5: Two-colored 3D-Plot with changing markers
-
. graph3d x y z, colorscheme(cr) mark
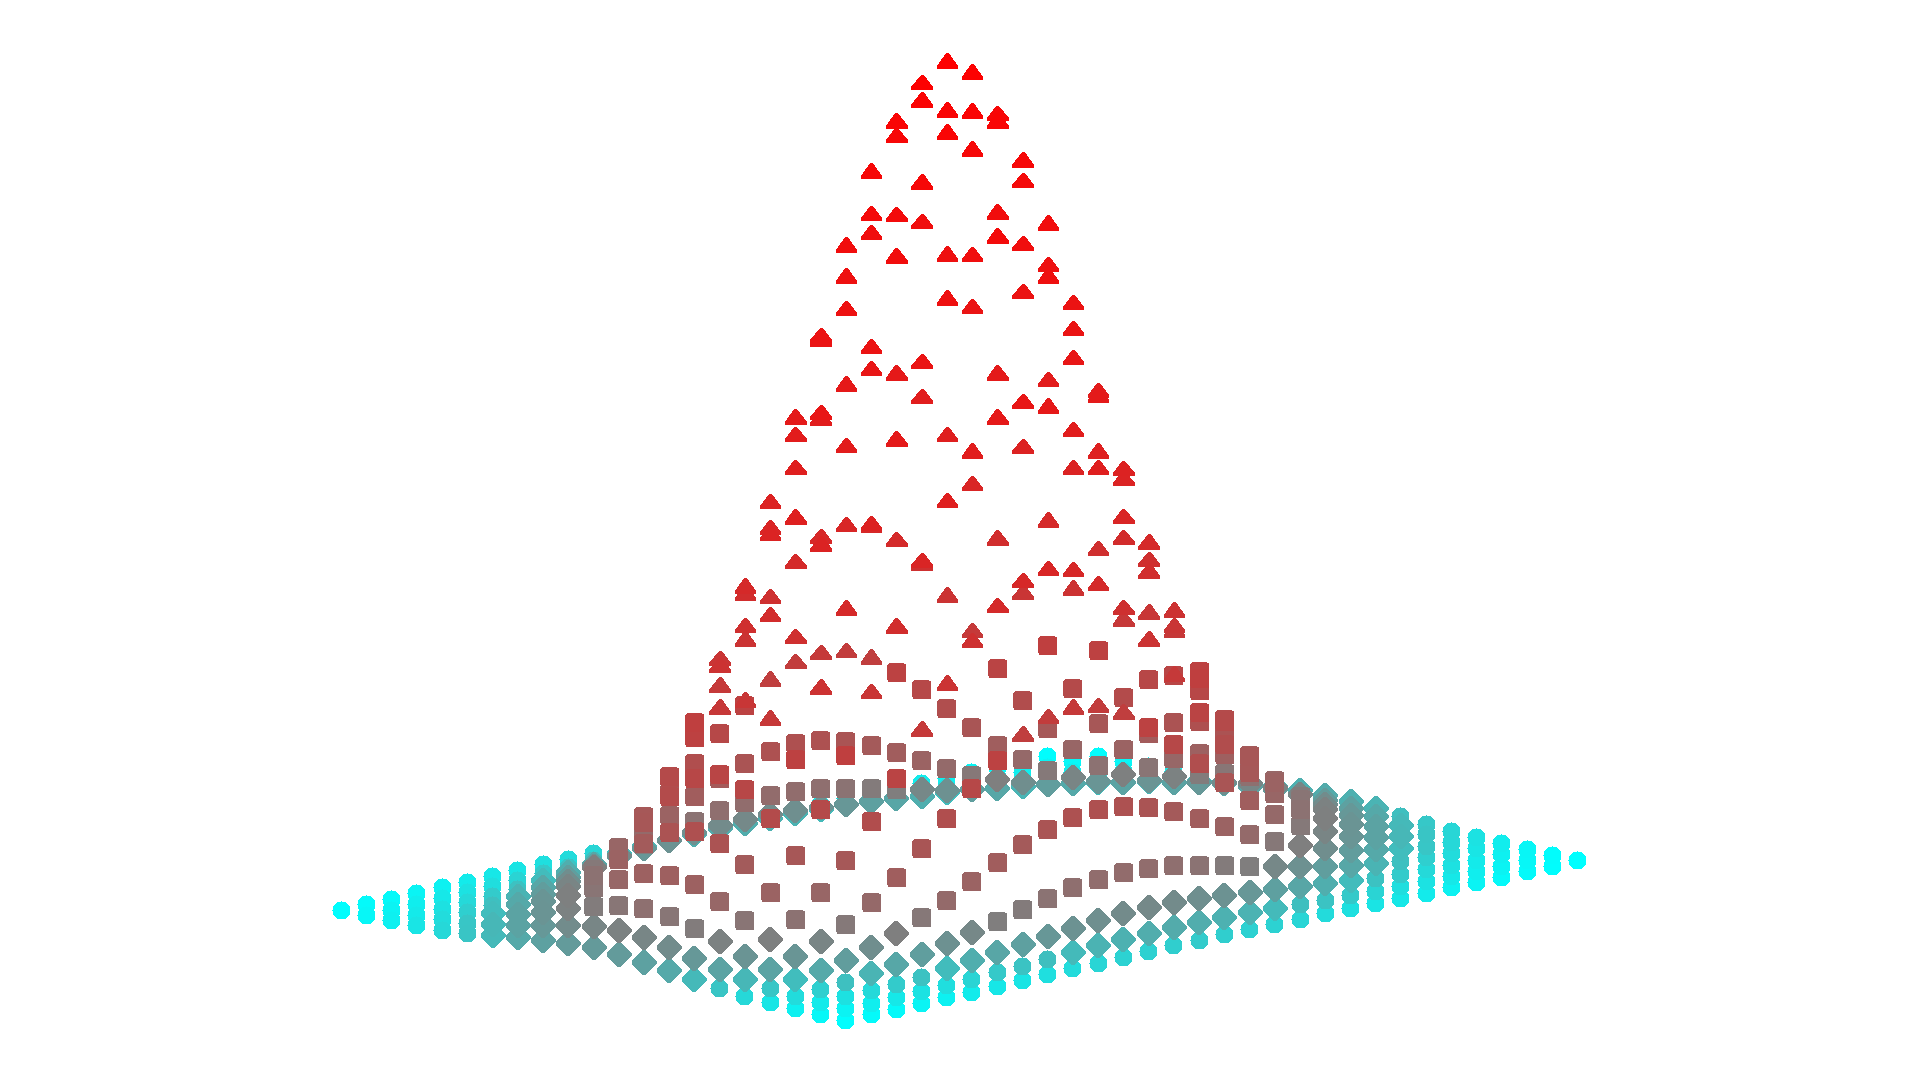
Example 6: Equidistantly two-colored 3D-Plot
with changing markers
-
. graph3d x y z, colorscheme(cr) mark equi
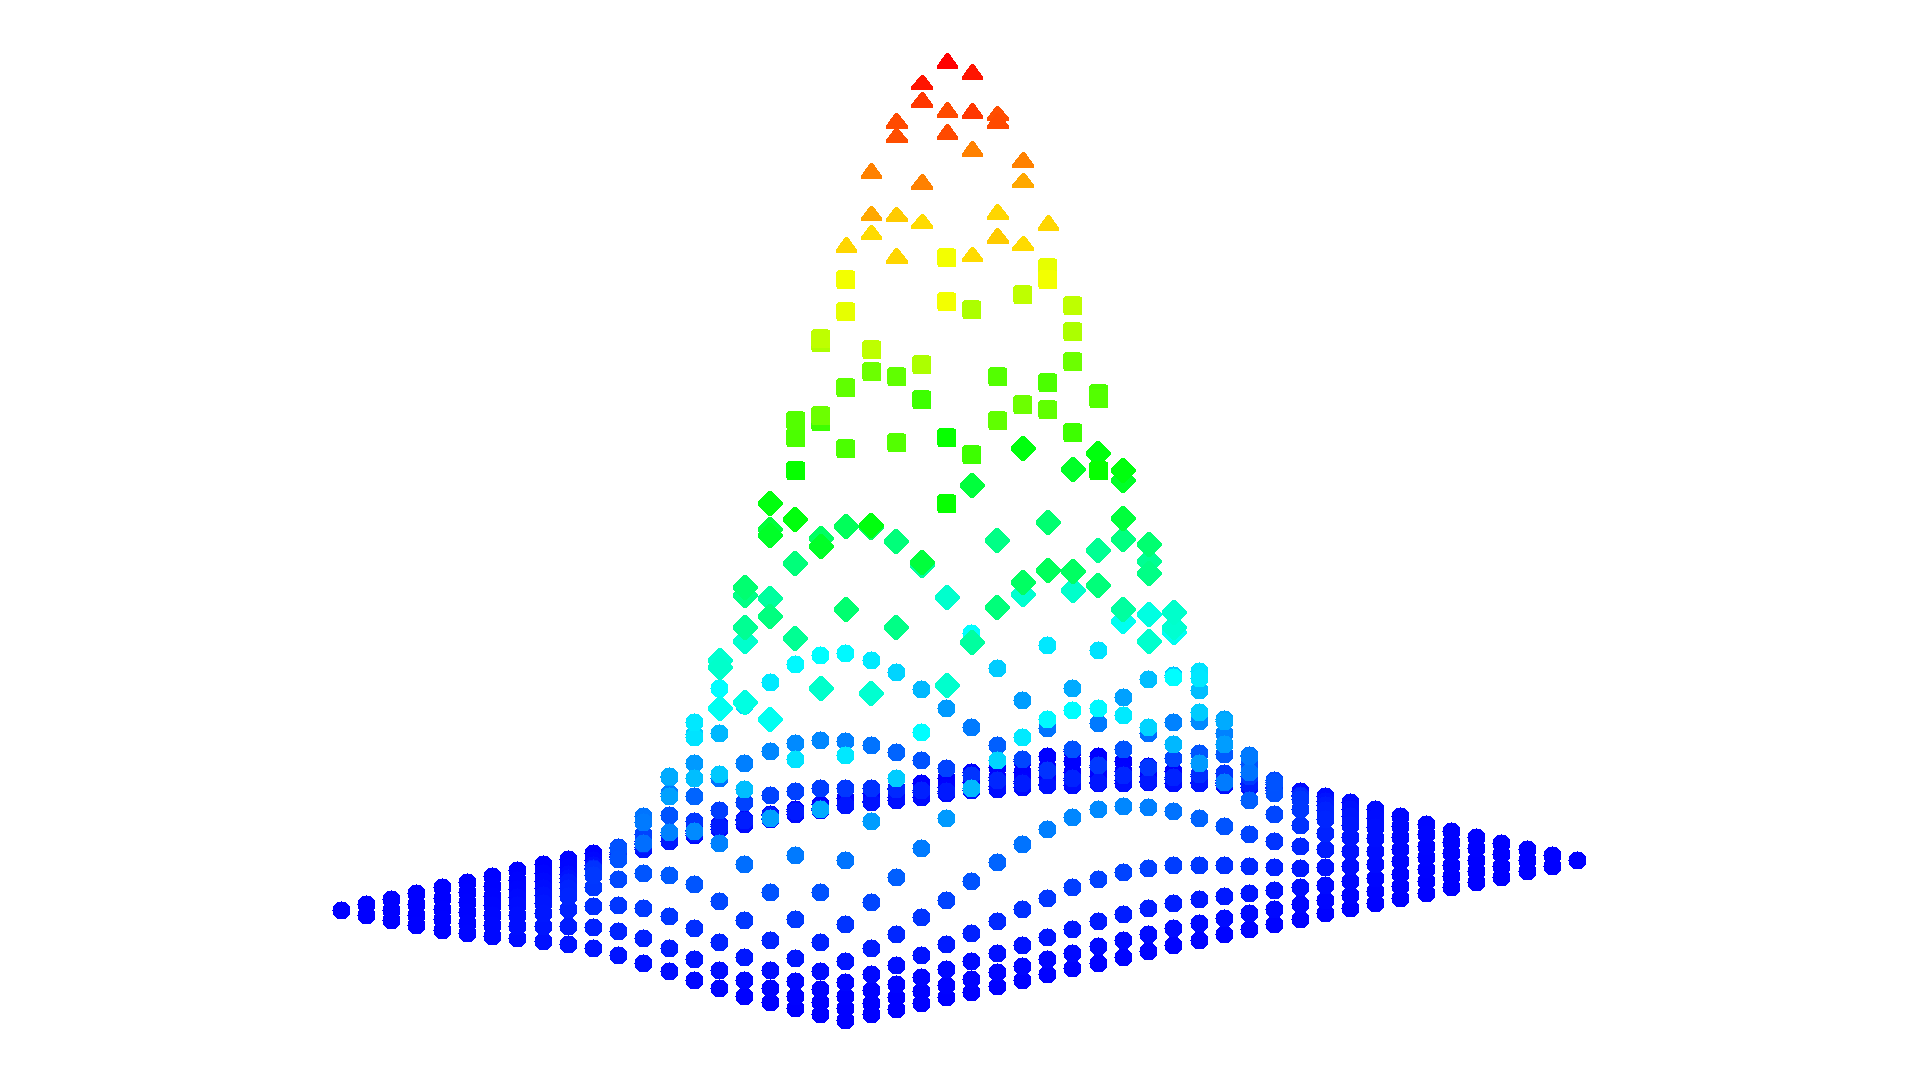
Example 7: Five-colored 3D-Plot with changing markers
-
. graph3d x y z, colorscheme(bcgyr) mark
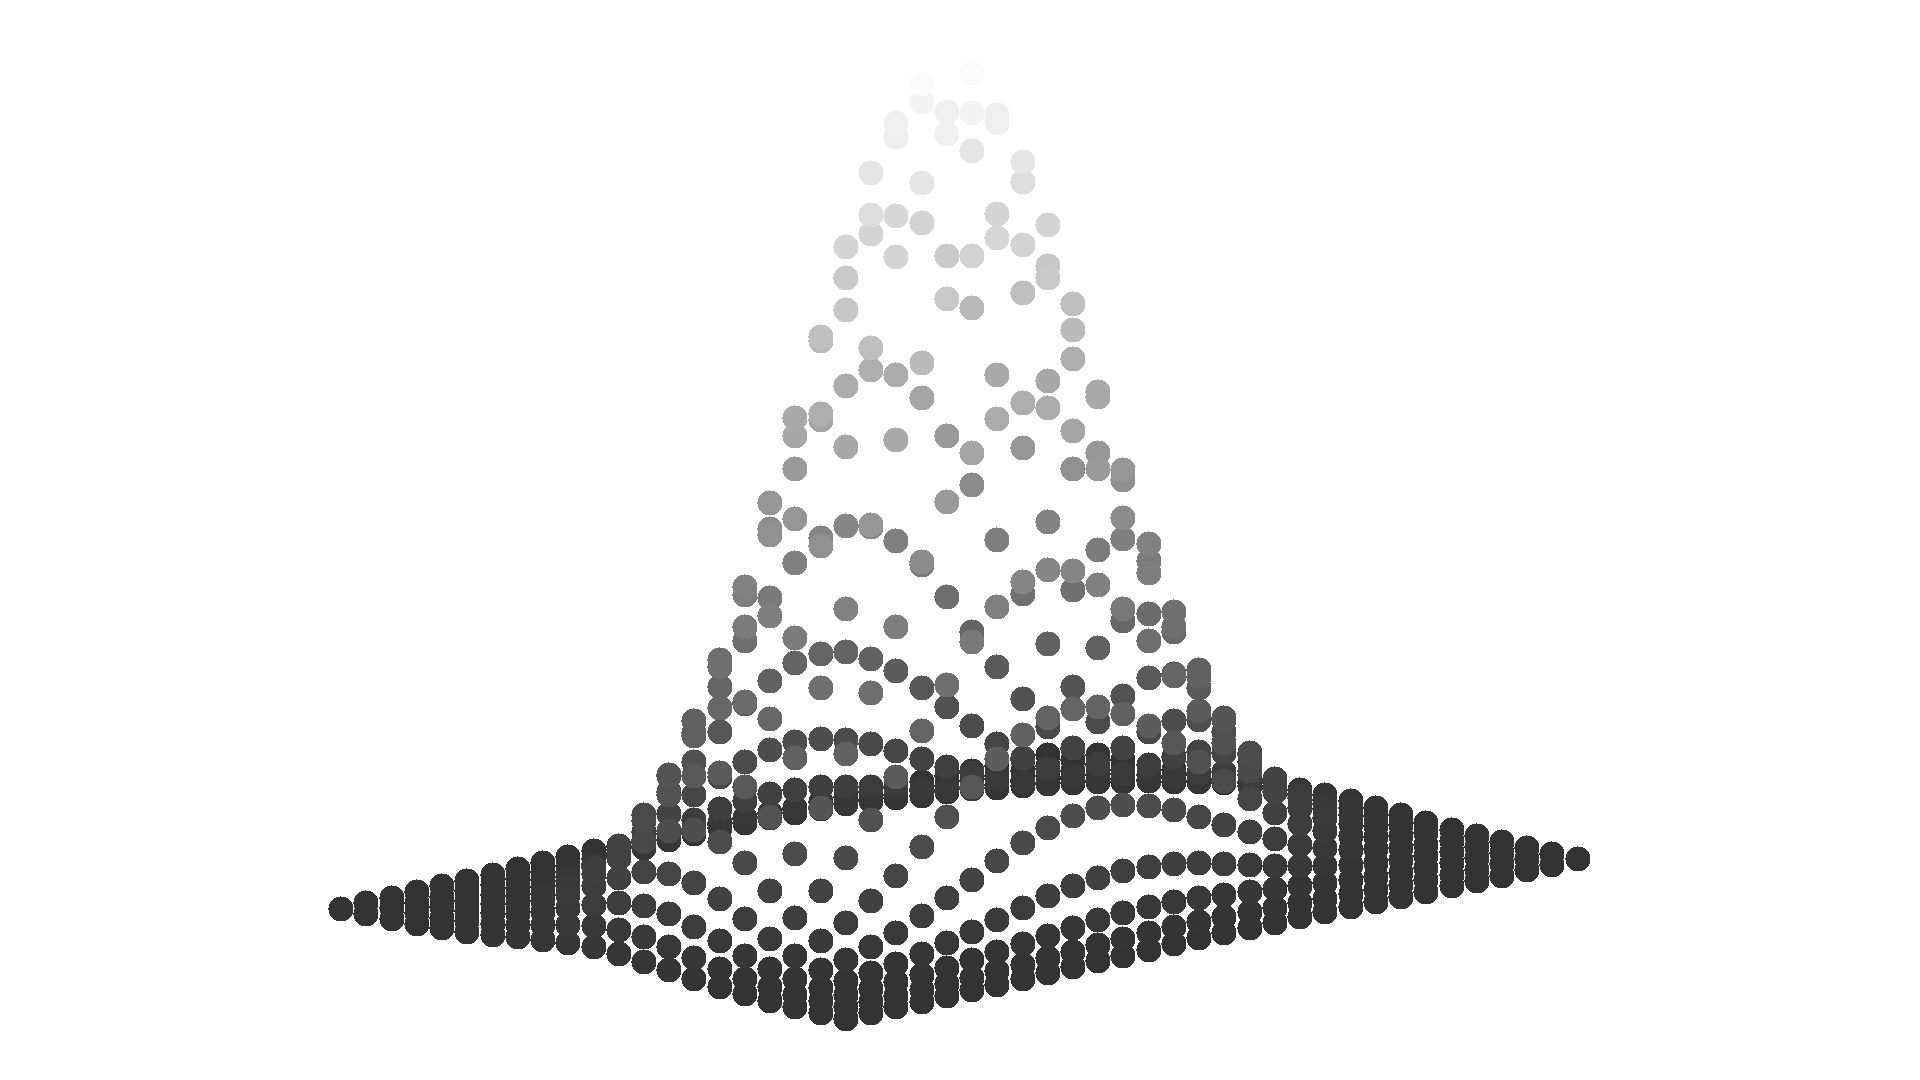
Example 8: Grey scale 3D-Plot
-
. graph3d x y z, colorscheme(fade)
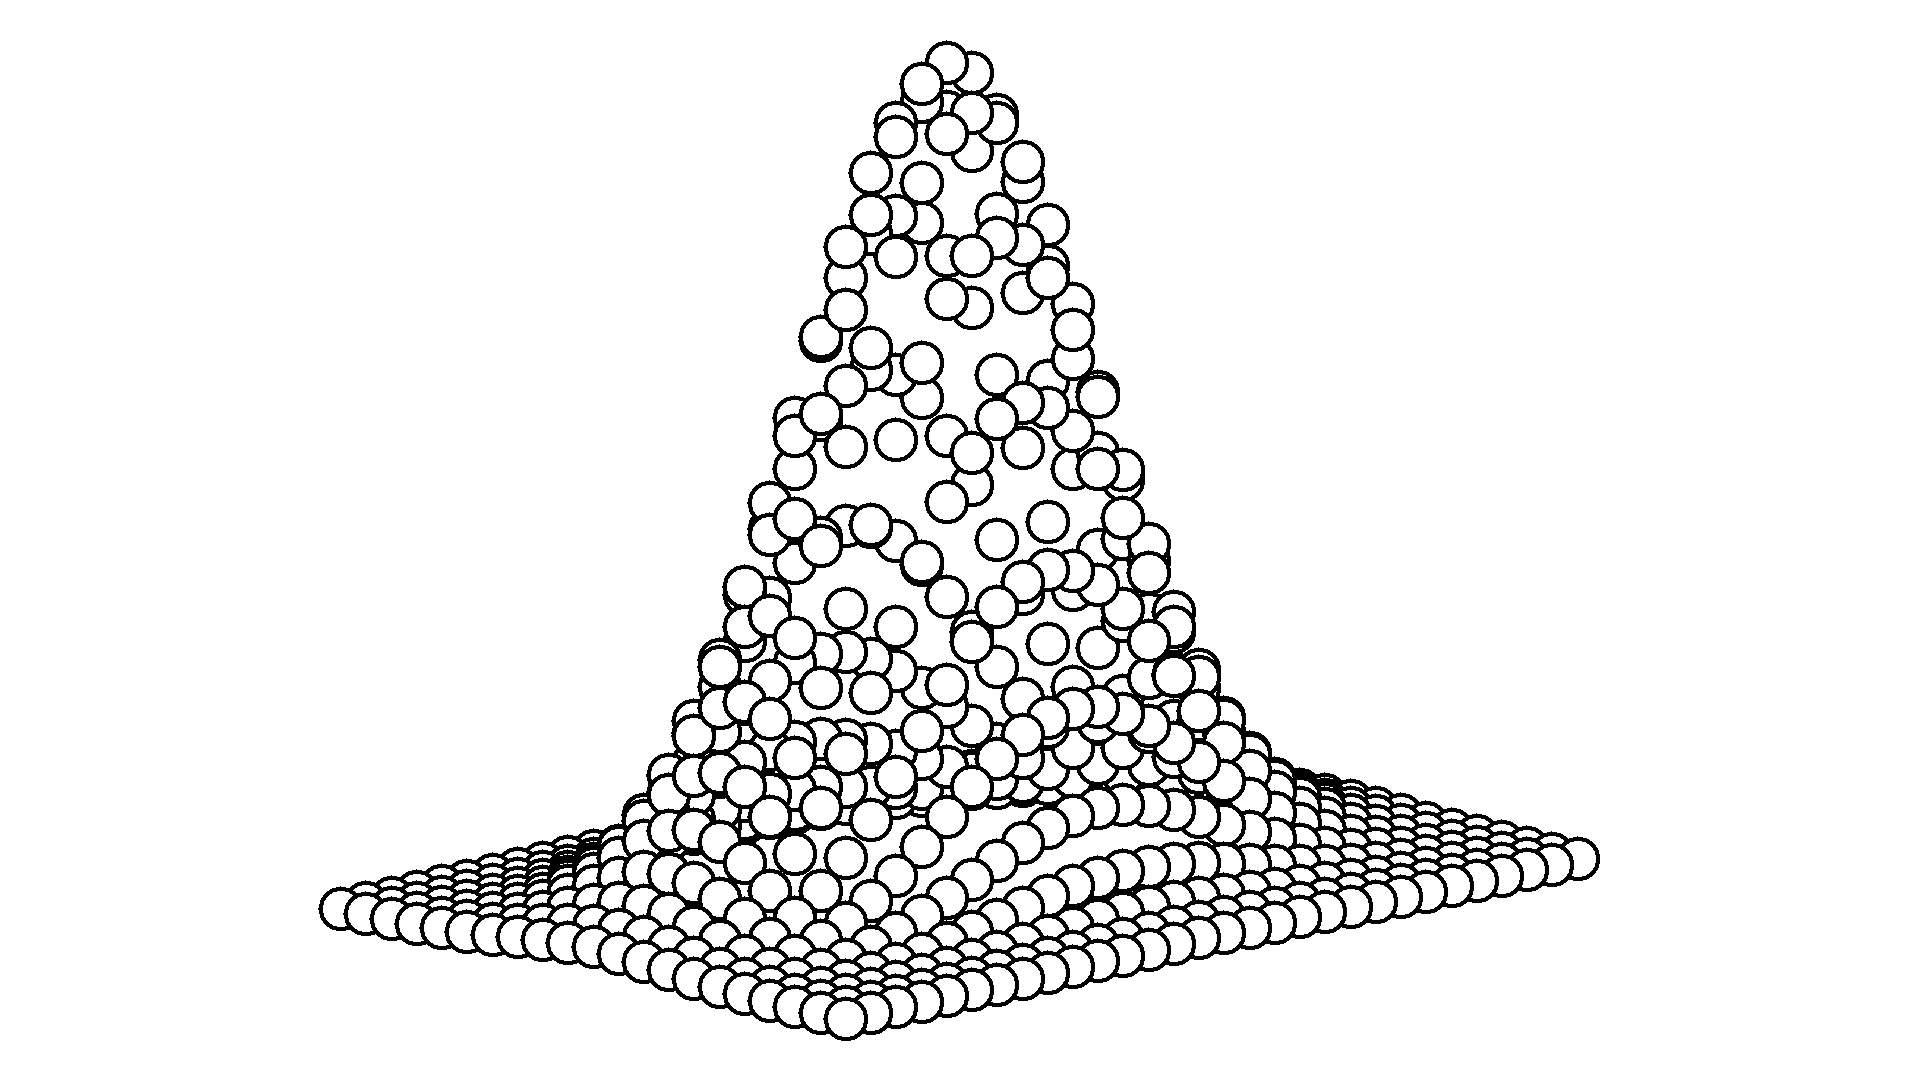
Example 9: Snowball 3D-Plot
-
. graph3d x y z, markeroptions(mfcolor(white) mlcolor(black) msize(3))
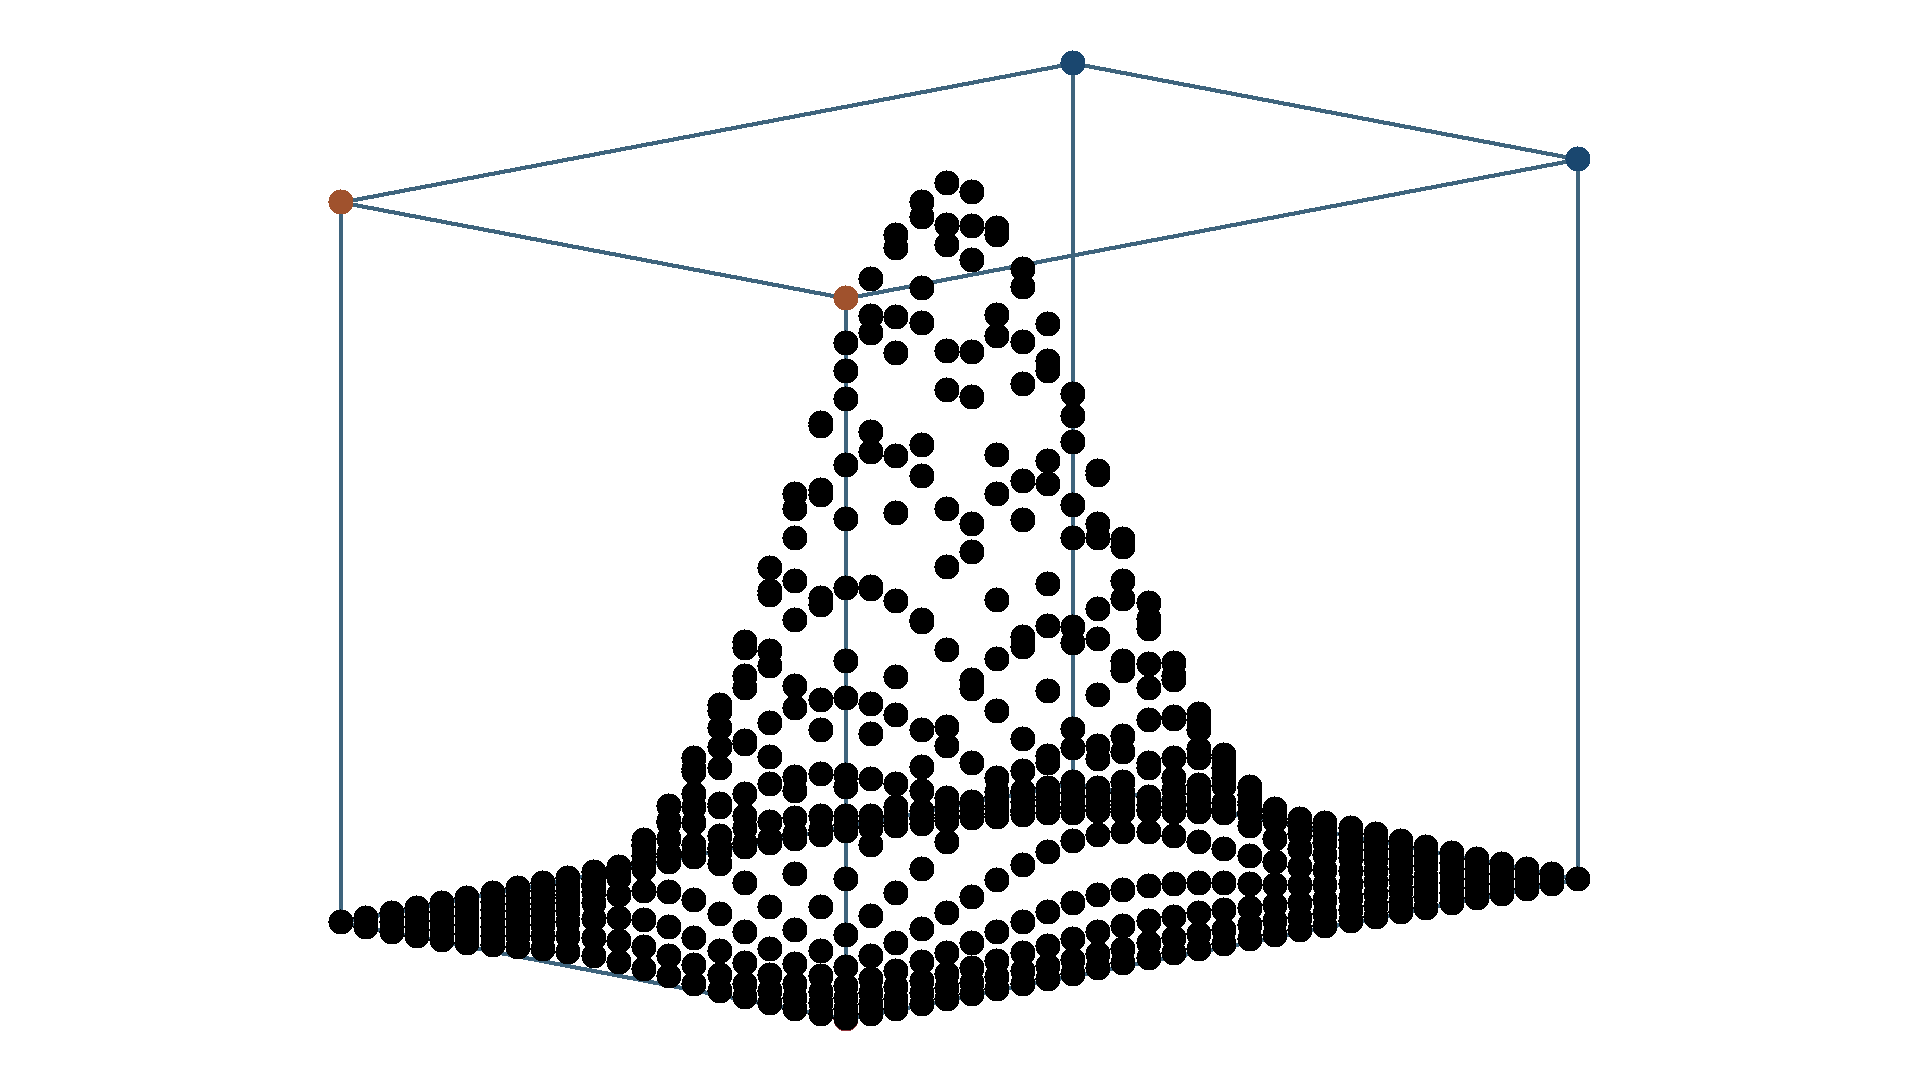
Example 10: Default 3D-Plot with outer grid-cuboid
-
. graph3d x y z, cuboid format("%03.0f")
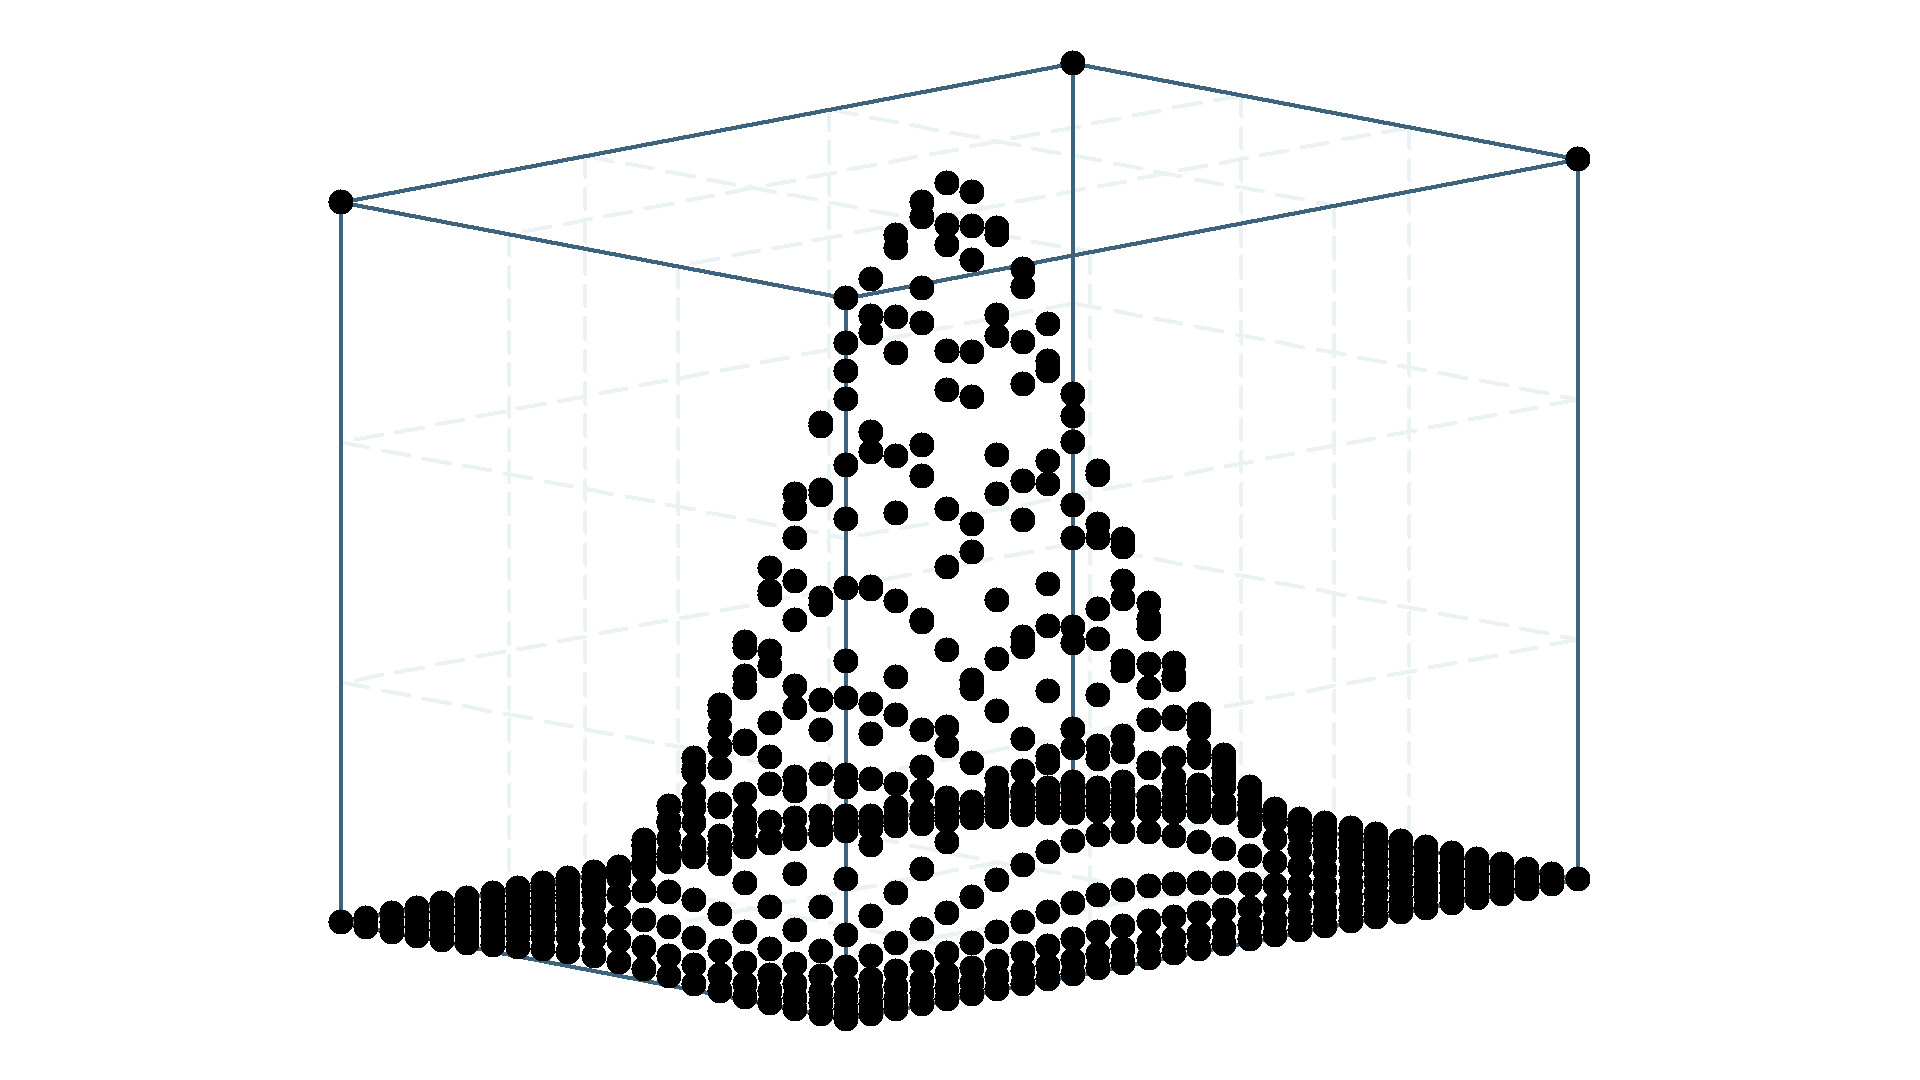
Example 11: Default 3D-Plot with outer and inner grid-cuboids
-
. graph3d x y z, cuboid innergrid format("%03.0f") blv
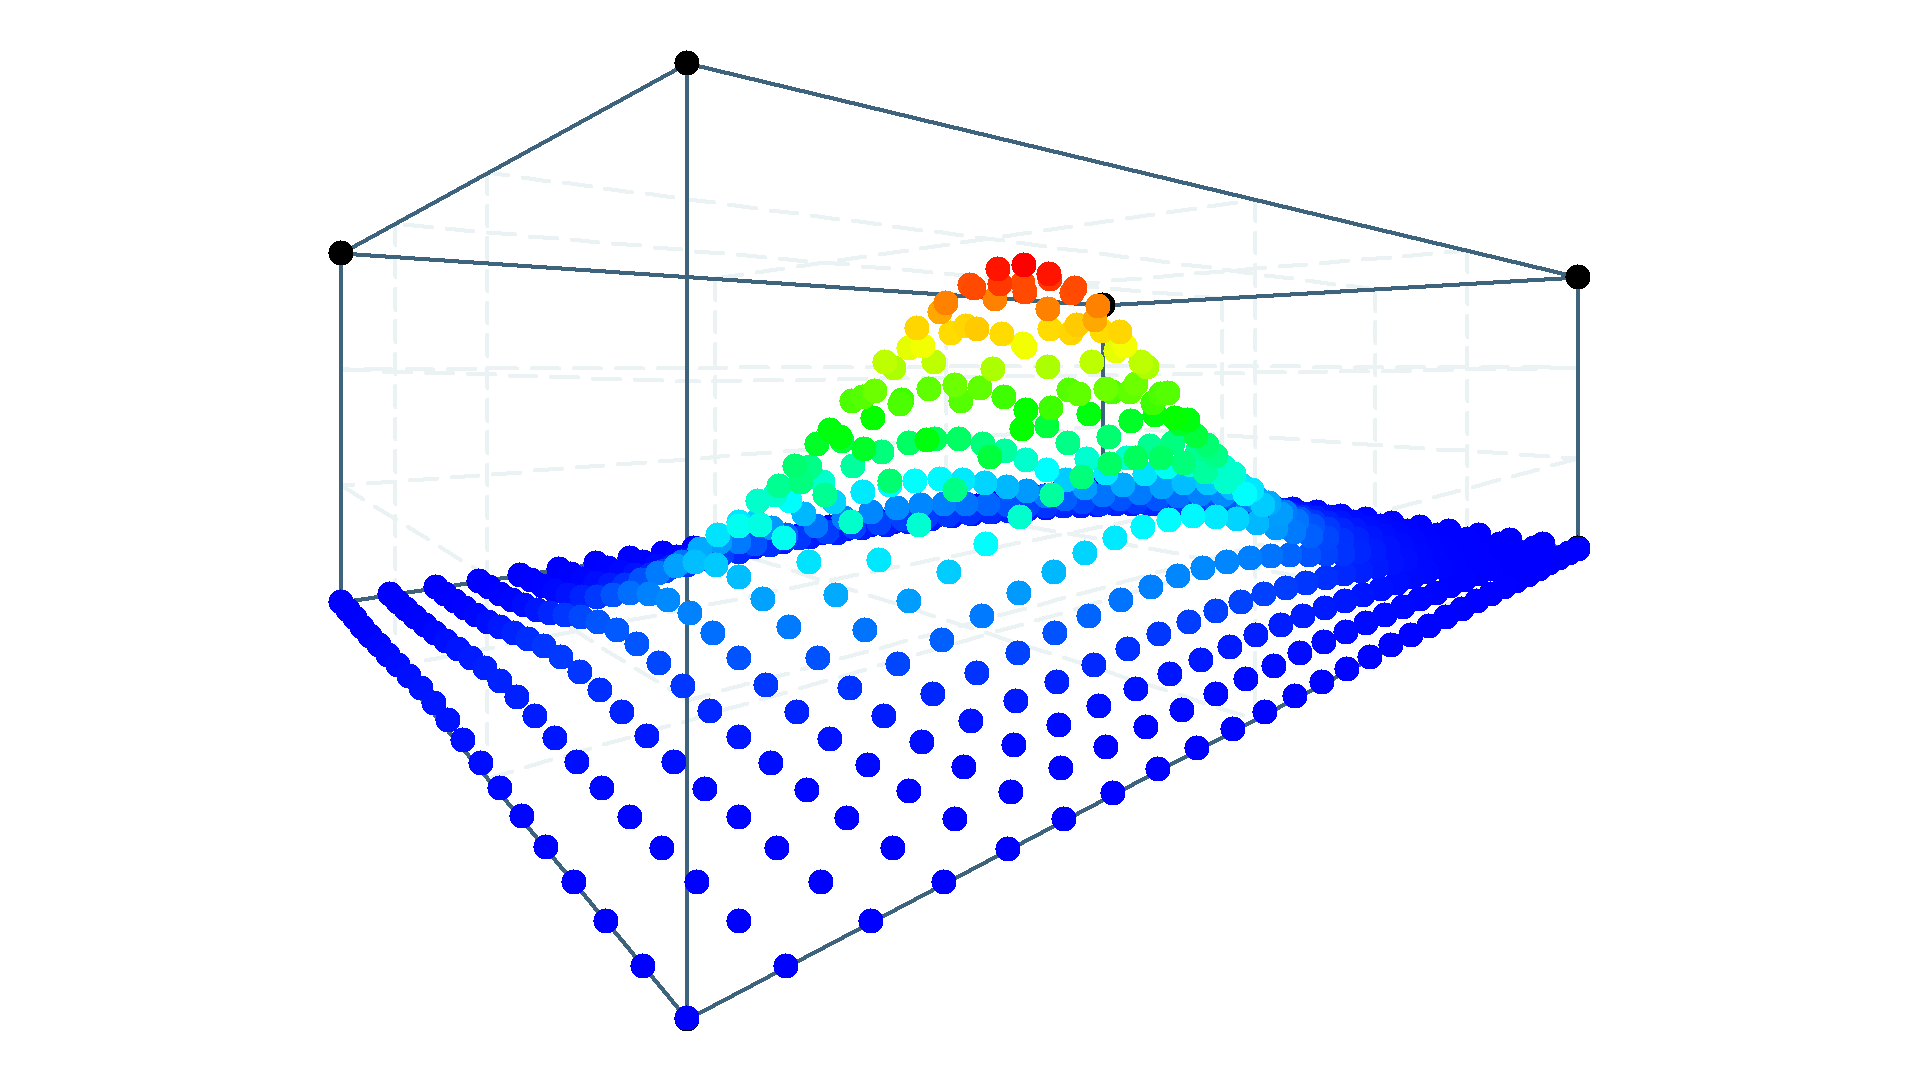
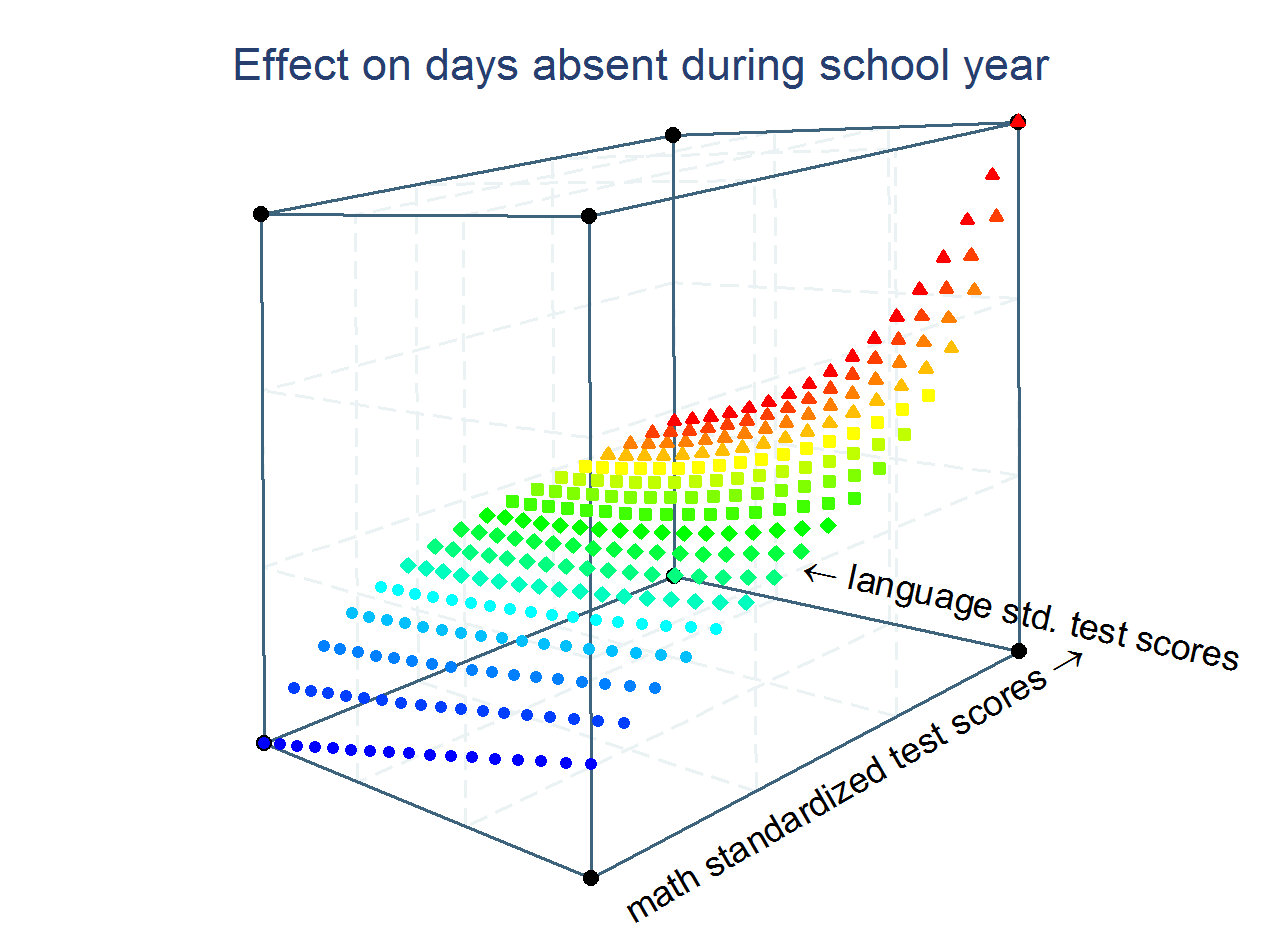
Example 12: Perspective 3D-Plot
-
. graph3d x y z, ycam(-4) zcam(-18) cuboid innergrid blv perspective colorscheme(bcgyr)
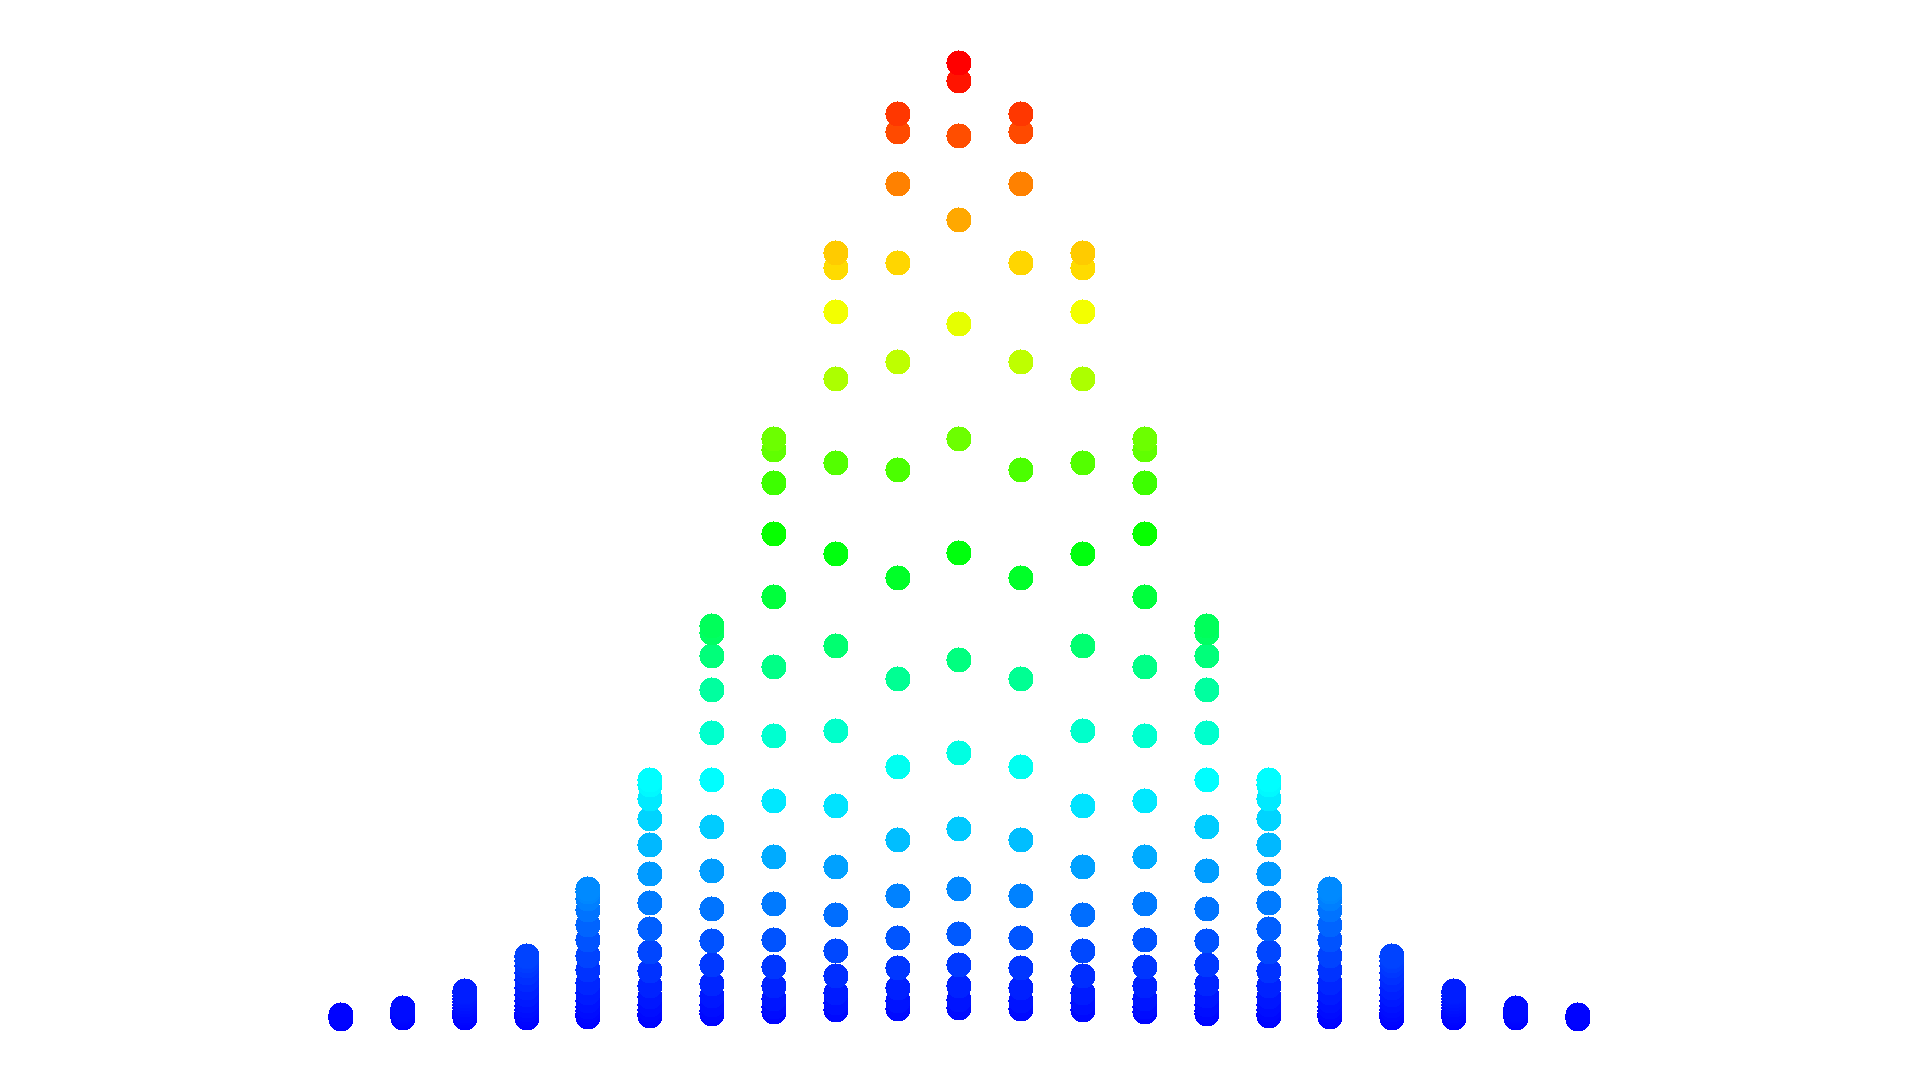
Example 13: Four-colored 2D-Plot
-
. graph3d x y z, xang(0) yang(0) zang(0) colorscheme(bcgyr)
Example 14: An economics application: budget constraints
- Getting the Poor to Work: Three Welfare Increasing Reforms for a Busy Germany
Authors: Robin Jessen, Davud Rostam-Afschar and Viktor Steiner
Public Finance Analysis, 2017, Vol. 73(1), pp. 1-41.
download Stata code here
Example 15: graph3d for margins plot
-
download Stata code here
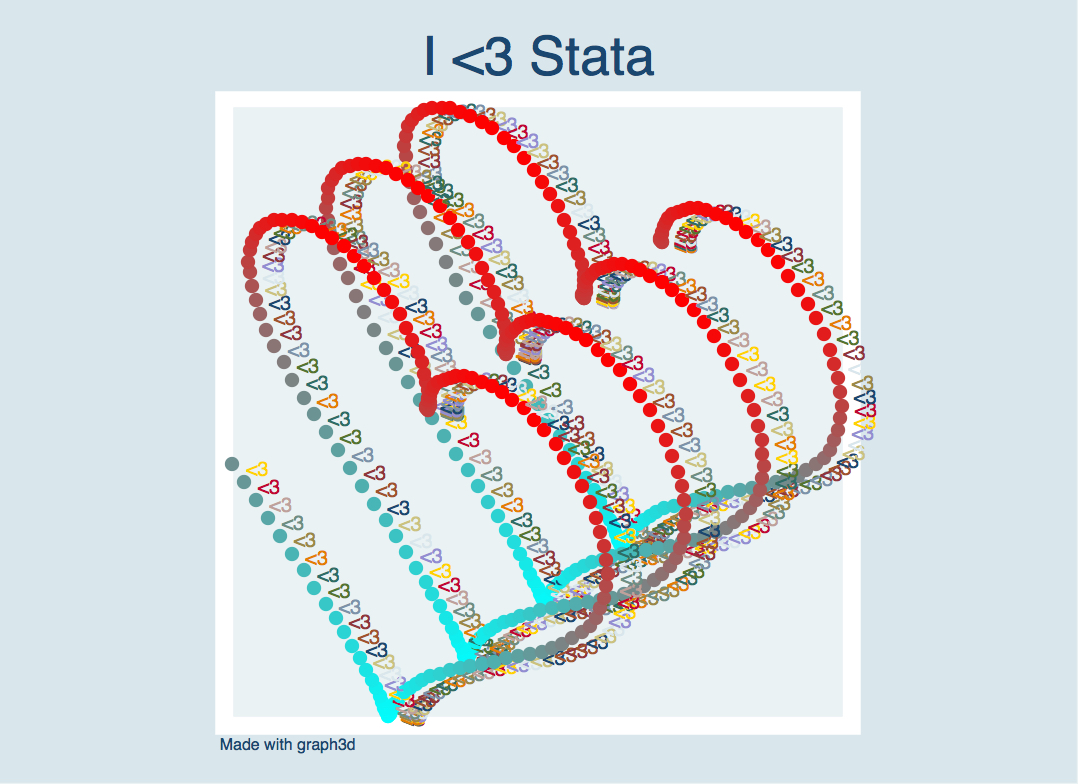
Example 16: Happy Valentine's Day
-
download Stata code here
Example 17: Growing 3D spiral
-
download Stata code here
Example 18: Spining 3D sphere in 16:9
-
download Stata code here
Example 19: Spining 3D sphere in 1:1
-
download Stata code here
Example 20: Rotating banana function
-
download Stata code here
Authors
Robin Jessen
Freie Universität Berlin
robin.jessen@fu-berlin.de
Davud Rostam-Afschar
Universität Hohenheim
davud.rostam-afschar@uni-hohenheim.de